
A data visualization system designed to help 87 department talent acquisition managers, deans, and directors understand workforce trends and make informed decisions.
Organization
University of Florida
Software
Figma, Power BI
Role
Graphic Designer
THE MISSION
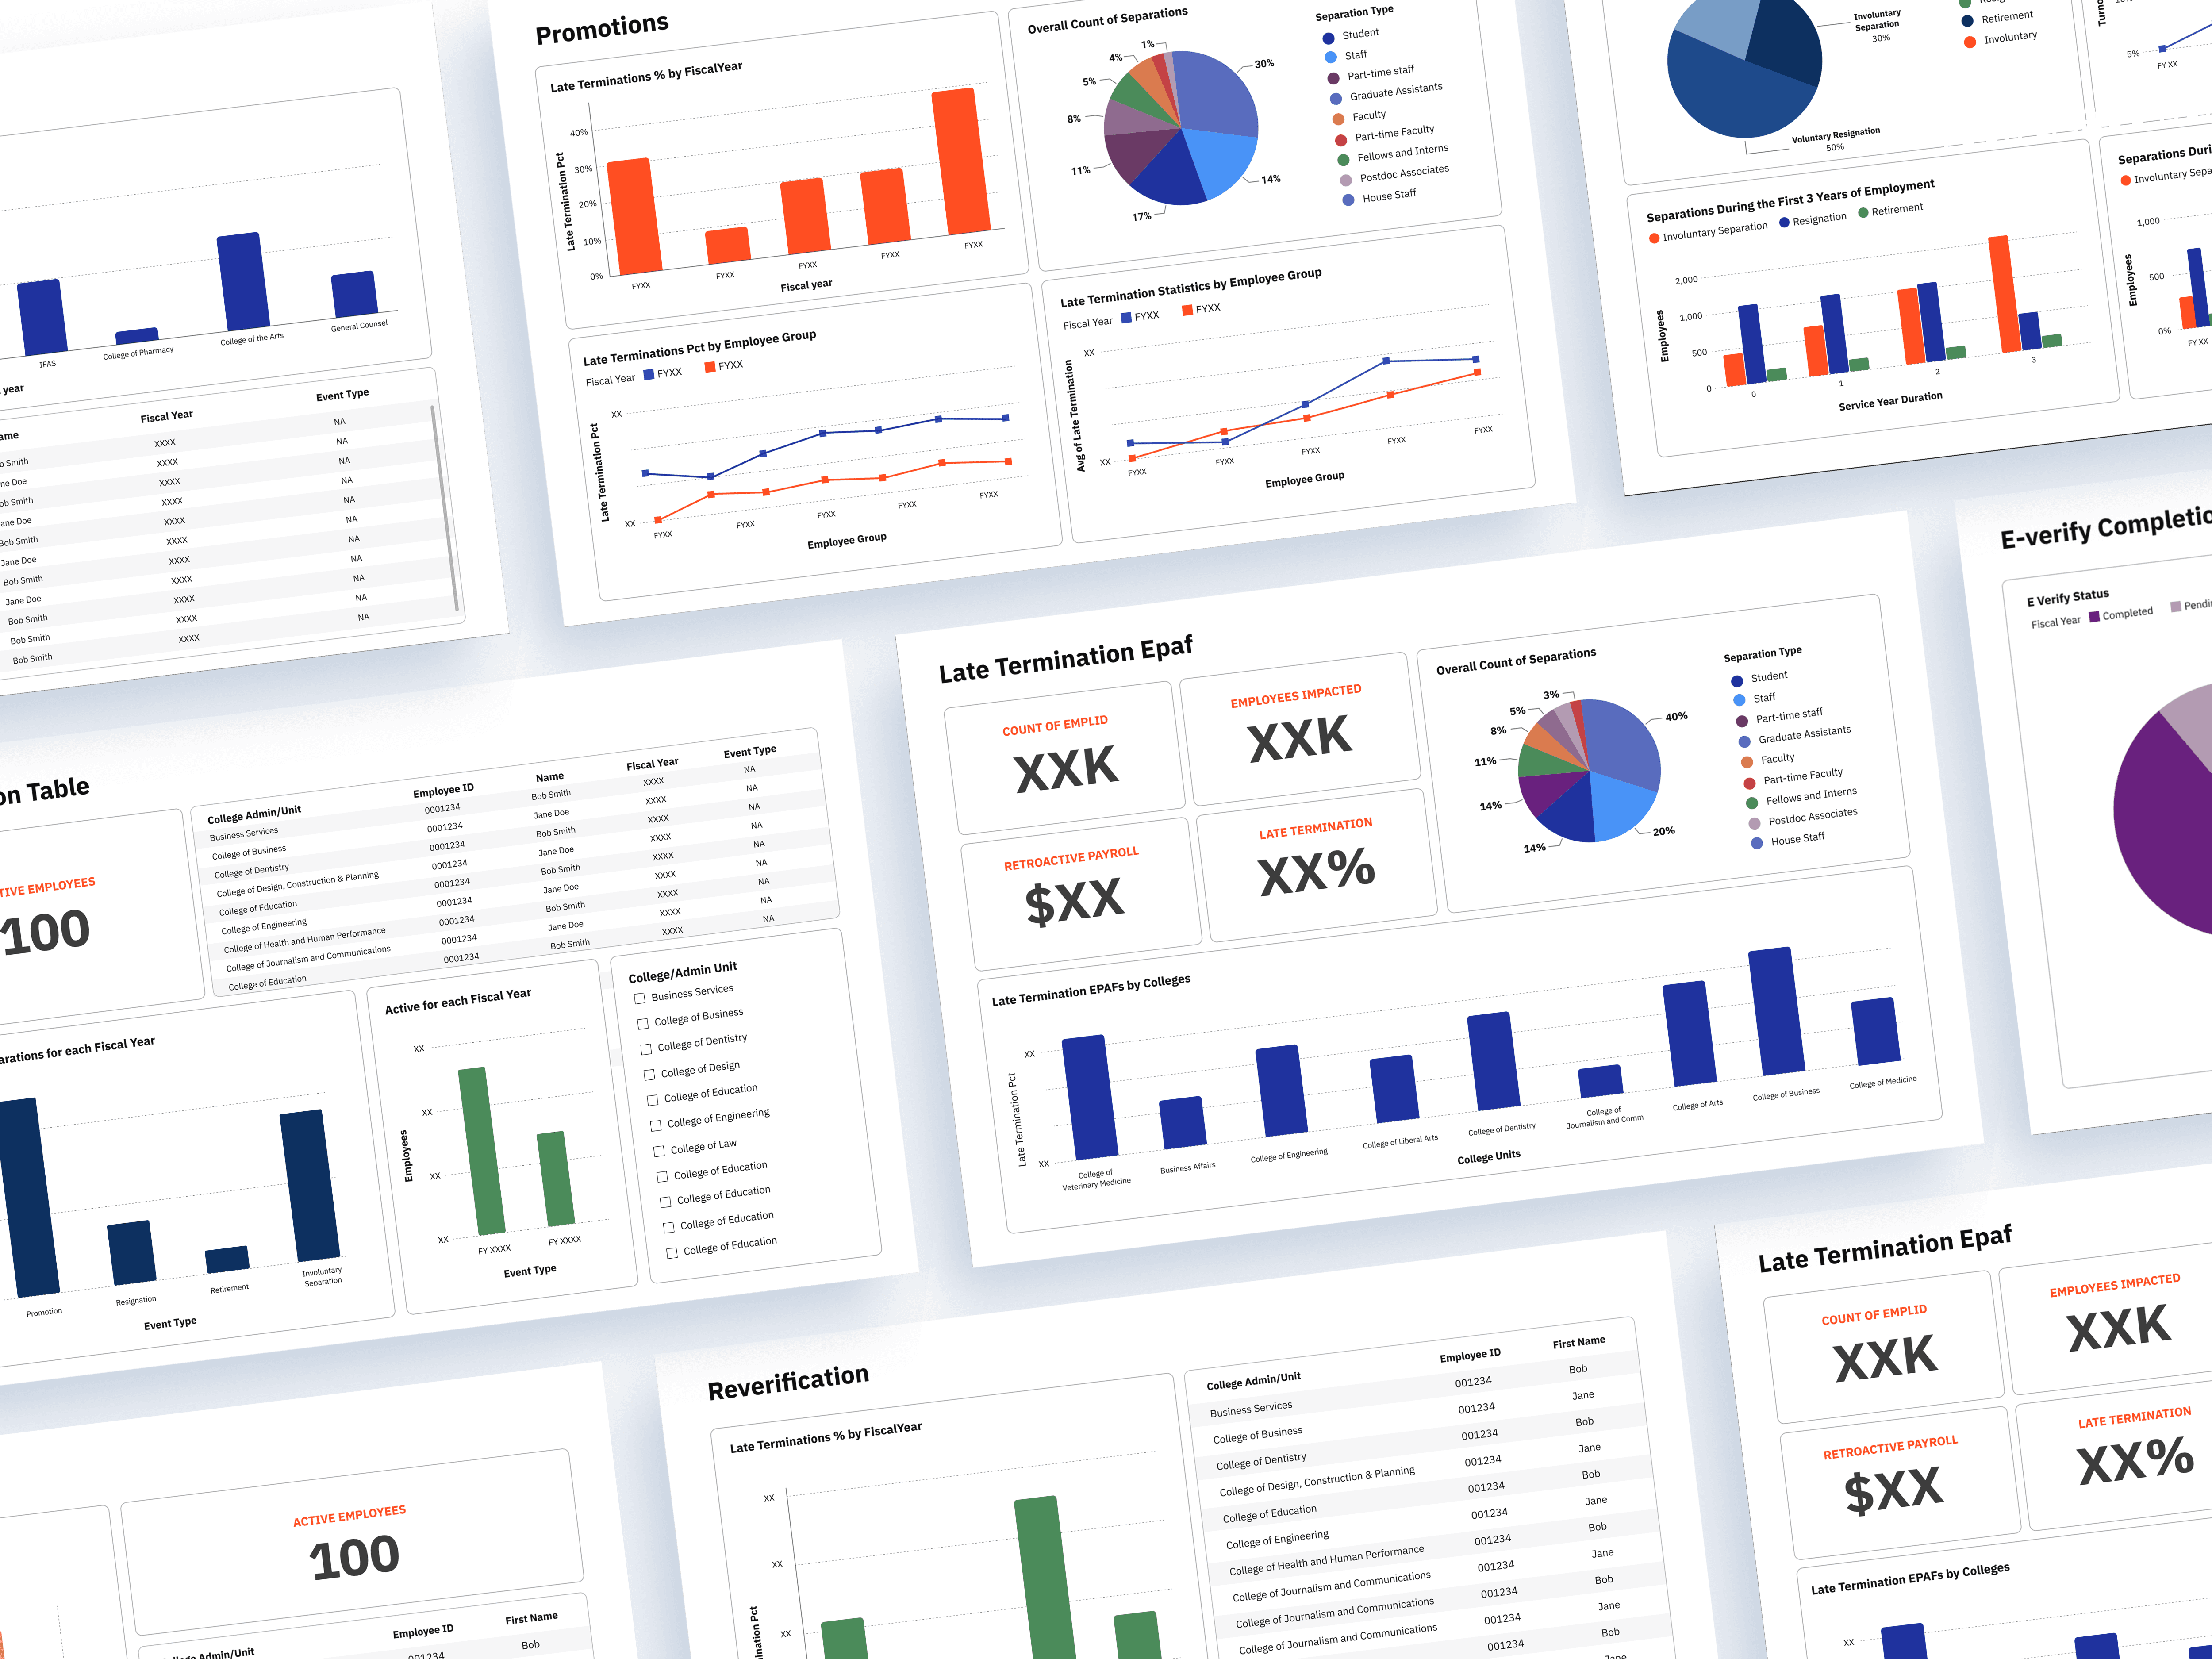
Workforce data across hiring, retention, termination, and reverification can be difficult to interpret when presented as raw numbers and spreadsheets. I worked with a data analyst to transform complex HR data into a series of dashboards that make key workforce trends easier to understand and act on.
PROJECT KICKOFF MEETING
I was given a set of 11 data and I had a kickoff meeting with the data analyst to understand the datasets, key metrics, and determine what information would be most useful to prioritize on each dashboard.

POWER BI FEATURES
Since the final product will be launched through Power BI, I explored the data visualization features available on Power BI. Below are the designs available:

BRAND GUIDELINES
Below are the logo and color guidelines of University of Florida that was used across the dashboards.

FIRST STAGE
I explored different data structure and layout to best visually present the data. Some things that I had to keep in mind was accessibility, branding, and the limitations of Power BI's functionality.


FINAL WORK
All of the data shown below have been fabricated for confidentiality purposes.


Testimony from one of the HR liasons

Kenya Williams
@Associate Director Human Resources, University of Florida George A. Smathers Libraries
As Associate Director and HR Liaison for the George A. Smathers Libraries, I find the Power BI HR dashboards to be an indispensable tool. Its intuitive layout, clear formatting, and accurate data display make is easy to identify and track everything from new hires to retirement, ensuring seamless support at every stage of an employee’s career.